Measuring the Performance of Web Service Calls
To measure and analyze the performance of web service calls, record their start and stop times. Use this information to determine the elapsed time, usually in milliseconds, of the web service call. After you have the web service time, you can use the times to list the averages, best and worst performances, summary, and more.
See the following topics:
•Step 1: Enabling Logging for the Ivanti Application Server
•Step 2: Enabling the Logging Level in the Configuration Database and in the Tenant
•Step 4: Running a Database Query
•Step 5: Reviewing the Results
Web Service Calls
The following are the web service calls in Neurons for ITSM:
•DashboardService.cs (3 items)
•DashbdSvc.GetDashboard
•DashbdSvc.GetSearchTargetObjects
•DashbdSvc.GetDashboardTree
•Knowledge.asmx.cs (1 item)
•Knowledge.GetSelfSvcKnwlgeWSData
•MyItems.asmx.cs (1 item)
•MyItems.GetMyItems
•SelfService.asmx.cs (5 items)
•SelfService.GetObjQukActnsByType
•SelfService.GetAnnouncements
•SelfService.GetAlerts
•SelfService.GetTopTopics
•SelfService.GetMyItems
•FRSHEATIntegration.asmx.cs (2 items)
•FRSHeatIntg.GetSchemaForObject
•FRSHeatIntg.GetAllAllowedObNames
•FormService.asmx.cs (6 items)
•Frmsvc.GetFormData
•Frmsvc.GetFormDataWithExprFields
•FrmSvc.GetDependentFormData
•FrmSvc.GetFormValidationListData
•Frmsvc.GetObjectLayoutDefById
•FrmSvc.GetChildTabLinkSelectData
•Layout.asmx.cs (1 item)
•Layout.GetLayout
•Save.asmx.cs (1 item)
•Save.SaveDataExecuteAction
•Search.asmx.cs (1 item)
•Search.GetSavedSearchesList
•Workspace.asmx.cs (4 items)
•Workspace.GetWorkspaceData
•Workspace.GetWorkspaces
•Workspace.GetRoleWorkspaces
•Workspace.GetFavoriteSearches
Service Names
There are several services, but to measure performance, we only use the service called Performance.
Performance Service Name
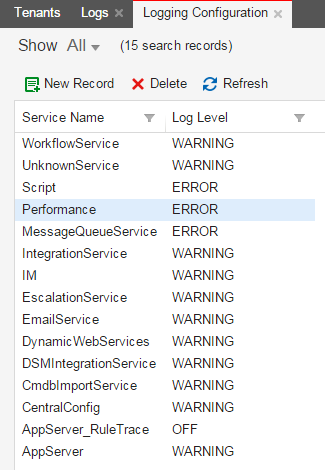
See Viewing the Logging Configuration for more information about logging.
Step 1: Enabling Logging for the Ivanti Application Server
Update the configuration file called FRSLoggingSettings.config to enable the Performance service. The following is an example:
<?xml version="1.0" encoding="UTF-8"?>
<configuration>
<appSettings>
<!-- Turns logging on and off for the host running the application -->
<add key="EnableCentralLogging" value="true" />
<!-- Where to read the logging settings from database from -->
<add key="ConfigureServiceAPI_ws_url" value="http://localhost/CentralConfig/ConfigServiceAPI.asmx"/>
<!-- Where to send the logs -->
<add key="LoggingService_ws_url" value="http://localhost/CentralConfig/ConfigServiceAPI.asmx" />
<!-- Specifies when to flush the log queue; whenever comes first, seconds passed or exceeding the log item size -->
<add key="ElapsedSecondsToFlushLog" value="60" />
<add key="ItemSizeToFlushLog" value="5000" />
<!-- Determines when to reload this file, and to refresh the log settings from database -->
<add key="LogSettingCacheTimeoutInMinutes" value="5" />
<!-- For the old logger -->
<add key="EnableLogging" value="true" />
<add key="RetrieveTenantLogLevel_ws_url" value="http://localhost/CentralConfig/RetrieveTenantLogLevel.ashx" />
</appSettings>
</configuration>
The EnableCentralLogging parameter determines if logging is enabled. If it is set to false, there is no logging. The default value is false.
The ConfigureServiceAPI_ws_url parameter specifies where to load tenant-specific settings from databases. The default value is http://localhost/CentralConfig/ConfigServiceAPI.asmx.
The LoggingService_ws_url parameter specifies where to send the log. The default value is ConfigureServiceAPI_ws_url.
The ElapsedSecondsToFlushLog parameter and the ItemSizeToFlushLog parameter specify when to flush the log queue.
The LogSettingCacheTimeoutInMinutes parameter specifies how often to refresh the log settings You can shorten or extend the value of the LogSettingCacheTimeoutInMinutes parameter at runtime. This applies for all tenants, upon reloading of this configuration file.
Step 2: Enabling the Logging Level in the Configuration Database and in the Tenant
The following are the log levels for all web services:
•ALL
•DEBUG
•WARN
•OFF
•FATAL
•INFO
•ERROR
To enable the Performance web service call, its severity level must be DEBUG or INFO. You set this value in both the Configuration Database (ConfigDB) for the entire application, and in the tenant for each individual tenant.
To set the log level for the Performance service in the ConfigDB, follow these steps:
1.Log into the ConfigDB. See the Configuration Database Guide for Ivanti Neurons for ITSM for more information about using the ConfigDB.
2.Go to the Logging Configuration workspace.
3.Double-click the Performance service name to open the record.
4.Change the log level to either INFO or DEBUG.
5.Click Save.
You must also set the log level in the tenant. The log level set in the tenant overrides the log level set in the ConfigDB.
To set the log level for the Performance service in the tenant, follow these steps:
1.Log in to Neurons for ITSM.
2.Go to the Logging Configuration workspace.
3.Double-click the Performance service name to open the record.
4.Change the log level to either INFO or DEBUG.
5.Click Save.
Step 3: Viewing the Log
1.Log into the ConfigDB. See the Configuration Database Guide for Ivanti Neurons for ITSM for more information about using the Neurons for ITSM Configuration Database.
2.Go to the Logs workspace.
3.Filter the Service Name column to only show Performance. The application displays all the logs for the Performance service. (If the Service Name column is not displayed, add it. See Working with Lists for information about how to add a column to a list.)
4.Double-click a log to open it.
Example Log Entry
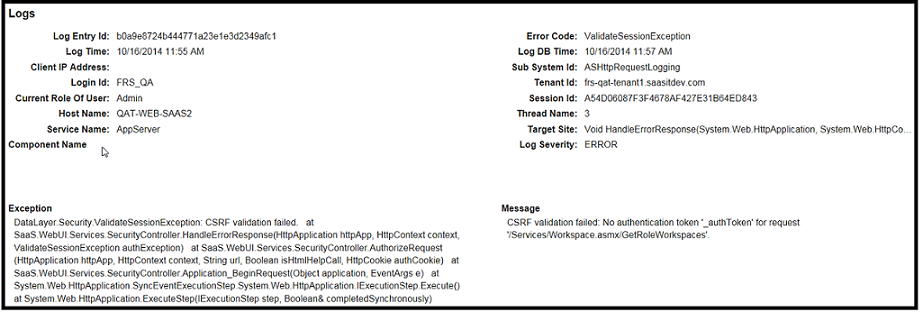
The following are the fields in the record and the database records associated with them.
| Log Record Field | Performance Record Field | Description |
|---|---|---|
|
Log Entry Id |
LogId |
ID of this log. |
|
Log Time |
LogTime |
The time when the log stops. |
|
Client IP Address |
ClientIp |
IP address. |
|
Login Id |
LoginId |
ID of the user running the log.
NOTE: The value cannot contain angle brackets. |
|
Current Role Of User |
UserRole |
The role of the logged-in user. |
|
Host Name |
Hostname |
The host name of the server. |
|
Service Name |
ServiceName |
Service name. This should always say Performance. |
|
Component Name |
WsUrlOrComponentName |
Not used. |
|
Error Code |
ErrorCode |
Not used. |
|
Log DB Time |
EntryTime |
The time when the log starts. |
|
Sub System Id |
SubsystemId |
Not used. |
|
Tenant Id |
TenantId |
ID of this tenant. |
|
Session Id |
SessionId |
ID for this session. |
|
Thread Name |
ThreadId |
ID for this thread. |
|
Target Site |
TargetSite |
Not used. |
|
Log Severity |
Severity |
The log level. This should always say DEBUG or INFO. |
|
Exception |
Exception |
The exception. |
|
Message |
Message |
The associated message. |
Step 4: Running a Database Query
With the results of the log, run a database query. The following is a sample query, that computes the transaction time:
WITH w3cformat AS (
SELECT
CONVERT(date, LogTime) as [date],
CONVERT(time, LogTime) as [time],
ClientIPAddress as [c-ip],
LoginId as [cs-username],
CurrentRoleOfUser as [cs-userrole],
Sessionid as [cs-session],
HostName as [s-computername],
'SOAP' as [cs-method],
ComponentName as [cs-uri-stem],
TenantId as [cs-host],
DATEDIFF (millisecond, LogDbTime, LogTime) as [time-taken]
FROM Logs
WHERE ServiceName = 'Performance'
)
SELECT TOP 5 *
FROM w3cformat
WHERE [date] = '2014-10-17'
ORDER BY [time-taken] DESC
Step 5: Reviewing the Results
You can view the results in a Microsoft Excel spreadsheet, in a table, or in a chart.
The following is a sample of the results in a table. (The table is shown on three lines for readability):
| date | time | c-ip | cs-username | cs-userrole | cs-session |
|---|---|---|---|---|---|
| 10/17/2014 | 23:09.1 | 10.10.100.100 | Admin | Admin | 10A1E1E7F2D741AE8C0D58AA7B4A6375 |
| 10/17/2014 | 19:08.4 | 10.10.100.102 | frs.tso | Admin | 723A0EB7F5964525BED53C0FCE411C07 |
| 10/17/2014 | 21:06.9 | 10.10.100.104 | jon.doe | Admin | 09958D7C6F934E1593C7BECA35DE8505 |
| 10/17/2014 | 19:38.2 | 10.10.100.107 | frs.tso | Admin | 723A0EB7F5964525BED53C0FCE411C07 |
| 10/17/2014 | 22:59.8 | 10.10.100.109 | Admin | Admin | 10A1E1E7F2D741AE8C0D58AA7B4A6375 |
| date | time | s-computername | cs-method | cs-uri-stem |
|---|---|---|---|---|
| 10/17/2014 | 23:09.1 | S607677CH4VW38 | SOAP | Save.SaveDataExecuteAction |
| 10/17/2014 | 19:08.4 | S607677CH4VW38 | SOAP | Frmsvc.GetObjectLayoutDefById |
| 10/17/2014 | 21:06.9 | S607677CH4VW38 | SOAP | Frmsvc.GetFormDataWithExprFields |
| 10/17/2014 | 19:38.2 | S607677CH4VW38 | SOAP | Workspace.GetWorkspaceData |
| 10/17/2014 | 22:59.8 | S607677CH4VW38 | SOAP | FrmSvc.GetFormValidationListData |
| date | time | cs-host | time-taken |
|---|---|---|---|
| 10/17/2014 | 23:09.1 | abc-stg.saasit.com | 466 |
| 10/17/2014 | 19:08.4 | xyz-stg.saasit.com | 233 |
| 10/17/2014 | 21:06.9 | xyz-stg.saasit.com | 233 |
| 10/17/2014 | 19:38.2 | xyz-stg.saasit.com | 186 |
| 10/17/2014 | 22:59.8 | abc-stg.saasit.com | 170 |